Welcome! I'm a digital projects specialist working with museums and academics on projects that combine technology and the past. My portfolio highlights some of the things that I've made, events I've organized, groups I belong to, and projects I've worked on … Learn More
About Me
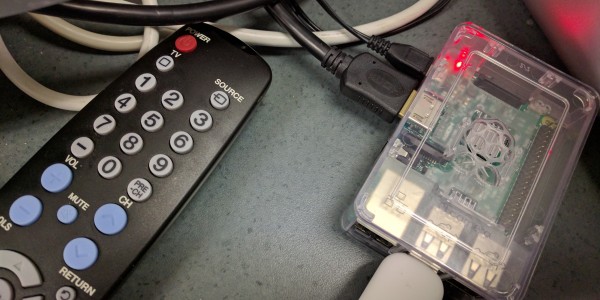
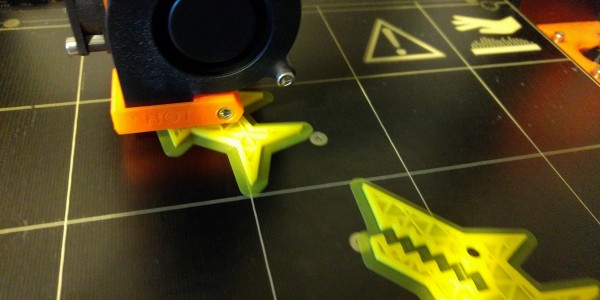
tech.
higher ed.
museums.
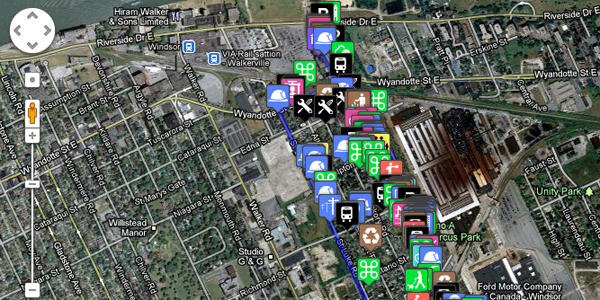
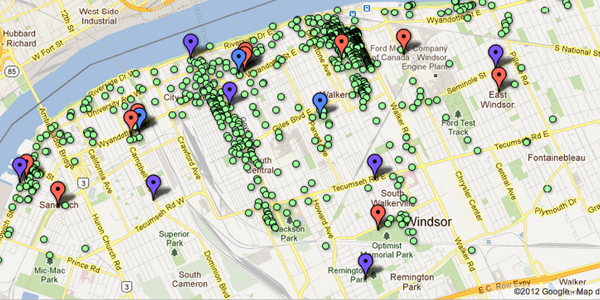
maps.
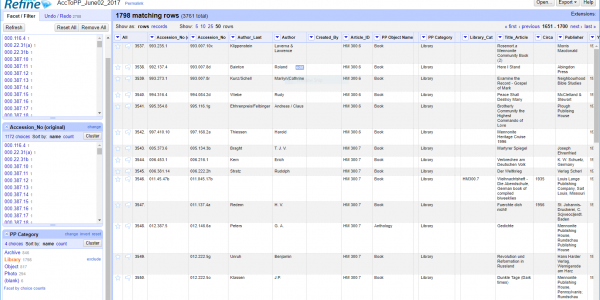
I use technology to make things, solve problems, and organize, archive, or share information.
I specialize in projects related to history, heritage, and culture. Everything I do is informed by … [Read More...]
Have we met?
Did we meet at a conference, workshop, meetup, presentation, concert, or online?
I'm currently booked until the end of 2017, but if you have an interesting project in the works, please get in … [Read More...]