Digitizing Texts

In late 2016, I was hired by the Essex-Kent Mennonite Historical Association to begin digitizing their collection to share online. After some copyright research and consultation with the Archives volunteers, we set a priority list and established a place to begin. The group has published 14 books about local Mennonite history since they incorporated in 1987 and these books could be useful to local and Mennonite historians, and the local Mennonite high school. Together, we identified this as the best place to begin.

Screenshot of EKMHA's online repository at ekmha.ca/collections

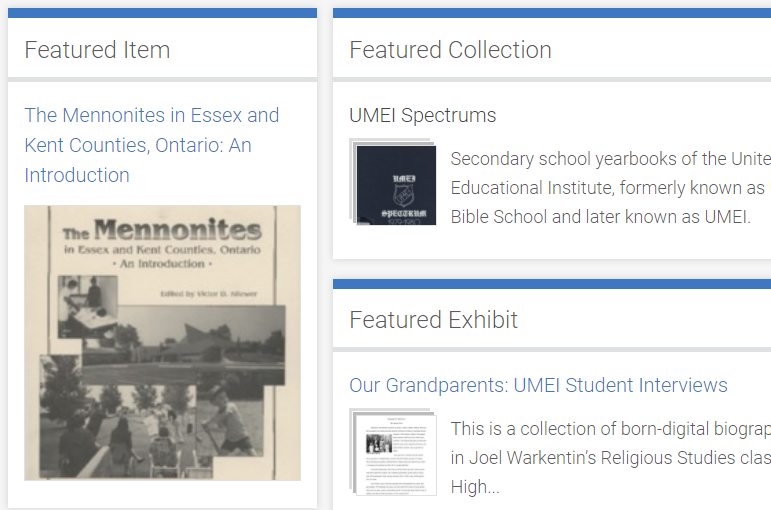
EKMHA’s online repository at ekmha.ca/collections

I worked on every stage of this project, from identifying current best practices, scanning equipment, OCR software, and repository options, to doing the scanning, OCR, metadata, publishing, and training and supervising volunteers to help.

The repository is built using self-hosted Omeka with a custom theme designed to match the organization’s website. In 2012, EKMHA hired me to convert their static html site built using MS Word to something more modern looking and easier to update. After four years, that site needed to be upgraded and updated before adding the Omeka repository. The result launched in early 2017: a combination WordPress and Omeka site that meets the organizations needs and is easy to update and maintain.

When the 14 books were complete, the project moved to digitizing high school yearbooks from United Mennonite Educational Institute (UMEI), 1947-1980, local senior biographies written by UMEI history students, and EKMHA’s newsletter. The online collection continues to grow.

The repository is available at www.ekmha.ca/collections/


Raspberry Pi Museum Kiosk

Raspberry Pi microcomputer with flashdrive installed

Raspberry Pi microcomputer with flashdrive

I got the idea for the kiosk from this tutorial about creating digital signage with WordPress and a Raspberry Pi, but felt like WordPress was more than I needed for the project I had in mind. Instead, this Pi runs feh, a command line image viewer and cataloguer.

Images are loaded onto a USB flashdrive, which is then inserted into the Pi. Any volunteer can provide a collection of images for the display. The slideshow script runs when the Pi boots up.  Slideshow is feh’s default mode with custom options including adjustable display time, auto-rotation, and borderless windows. I add captions to the images using an ImageMagick script which extracts the caption field from Picasa and appends it to the bottom of each photograph using -annotate. (Funny story: I happened to be using a Windows computer the day I was working on this. If you’re not used to using ImageMagick on Windows, you might not know you must preface each command with magick. I did not know this when I started, but I do now…)

So now every weekday morning, visitors to the Mennonite Heritage Centre in Leamington, Ontario are greeted by three things: a friendly guten tag from Walter Koop behind the desk, the aroma of freshly-brewed coffee prepared by cafe volunteers, and a slideshow of photos.

Recently, the front desk acquired a digital kiosk, consisting of a 23-inch computer monitor and a raspberry pi. A raspberry pi is a microcomputer, only slightly larger than a deck of cards. Each day, Walt Koop selects a collection of photos to feature on the kiosk; so far the most popular set is EKMHA’s collection of wedding photos spanning from the 1920s to the 1970s.

Whether they’re on their way to or from coffee, choir, or exercises in the auditorium, you can often find a group of people enjoying the display, and remembering their friends and families on their special days.

At the Heritage Centre, you’ll often find a mix of the old and the new. We’re glad to be able to share items from our collection with our visitors in this way. The archives contain many more treasures like these and we encourage visitors to come in and explore. We also welcome donations of photographs and other items. Email info@ekmha.ca for more information.

Museum visitors watching the kiosk slideshow

Museum visitors watching the kiosk slideshow

A less-technical version of this article appeared in EKMHA’s Spring 2017 newsletter.

ProfHacker OpenSearch Plugin

Firefox search options in a drop down menu

Photo credit: Brian Croxall

I’ve been a regular reader of ProfHacker since its launch (i.e. before it moved to the Chronicle of Higher Education Blogs). The tips and tutorials are helpful – and usually timely. I found the site so useful that I was constantly sharing links with colleagues, but I’d accumulated so many bookmarks that sometimes finding the right article was a challenge. What I really needed was an easy way to search the site.

I took this as an opportunity to create a ProfHacker.com Firefox search plugin using OpenSearch. Then, when I needed to find something on ProfHacker, I could use the browser search bar (using Ctrl+k / Cmd+k) to choose ProfHacker from the list of available search engines.

Once ProfHacker moved over to the Chronicle of Higher Ed, the ProfHacker.com site specific search plugin broke, but the tool was great while it lasted.

University of Windsor Feminist Research Group

a mosaic of the 2009 FRG conference. There are people presenting at lecterns, sitting on the grass, chatting, singing and playing guitar

2009 FRG Conference at the University of Windsor

I’ve been a member of the University of Windsor Feminist Research Group (FRG) since 2005. The group’s founding focus was an annual conference, organized by and for graduate students. The first year I submitted my submission was…slightly unusual…so I was invited to present “Ladies’ Tea: the Board Game” even though I was still an undergraduate student.

FRG program 2005 - Inter-Actions: Exploring diverse feminist perspectives

The conference program from FRG’s 2005 conference

After attending that year, I got involved with the organizing committee, helping on the technical side with websites and program design, as well as with outreach, promotion, and organizing the social events for the conference after-hours. I also continued to present papers each year.

After 10 years of annual conferences, FRG has shifted towards other forms of feminist research. Even though I’ve finished grad school and I’m not currently teaching, I’ve stayed involved with the group for the connections and support that a group like this provides.

Maryan Amalow, ED for Part-time Students at the University of Windsor in the student centre at the University of Windsor

Maryan Amalow, ED for Part-time Students at the University of Windsor

For International Women’s Day 2012, I coordinated an FRG photobooth in the student centre to photograph students and submit them to the Feminist Photo Blog Project, challenging the “This is What A Feminist Looks Like” stereotype and in April 2012, I coordinated a face-to-face plus video book club with author Margaret Dilloway for FRG members to discuss her book, How to Be an American Housewife. To video conference with the author, we used Google’s new (at the time) video Hangouts tool.

I continue to provide technical support to the group, mostly helping to manage the listserv as needed.

Mapping Community Assets: Learning by doing

University of Windsor Social Work students have agency placements in their senior year, where they gain experience in the field and make community connections. Each student brings enthusiasm and unique skills to their organization. Take Lillian Gallant for example: her placement was been at the Ford City Neighbourhood Renewal project (housed in the Gino A. Marcus Community Centre).

Lillian started out with a plan to inventory the community, and from there, she developed a “community asset map” using GoogleMaps. Combining her interest in emerging technologies and her social work background led to this fantastic map of the neighbourhood. The process was a hands-on way for Lillian to learn about the community and the resulting visualization is a great way for her to share the results with the community.

I consulted on the technical aspects at each stage of the project.

Click on the different icons to reveal information about each asset:


View Ford City Community Asset Map in a larger map

Mapping with kids

On Friday nights while my middle kid practices with his soccer team, my youngest and I go to the nearby coffee shop and work on code. He’s 10 years old. Our first project was a Choose-Your-Own-Adventure program in Python, then we moved to a random generator (again in Python), and last night he mapped some of the places he’s been, using Google Spreadsheets and Fusion Tables. The original plan was to map all the places he’s been, but he decided to cap it at 15 since we had just under two hours. I wanted him to finish the night with something completed.

Here’s the map he made:

Blue is for pools

Red is for libraries

Purple is for schools

Orange is for stores

Green is for restaurants

I’m inspired by my daughter, who’s taking her last year of high school computer science. The school she’s at offers three years of courses. In year one they do Turing (and Flash), the next is Python, and in the last they do Java. She’s planning on going on to study either Computer Science or Engineering at university in another year. She also loves the humanities so I’m excited to see what combination she puts together with double majors or minors.

I’m eager for my kids to grow up as creators, not just consumers of technology. The two younger kids both have old computers that run Ubuntu (one has no internet, one has restricted internet) so their use of the machines might be different because of that. They first started out making their own levels in kGoldrunner, but they’ve moved on to spreadsheets of stats for the characters in the role-playing games they create as well as using the word processor in Open Office to write stories for their games. Learning to program seemed the next step, but one they weren’t making on their own. Friday night at the coffee shop seemed like a good way to clear away distractions, learn something new, spend time with mom, and wait for big brother to finish practice. It’s also great for the youngest to learn something before his older brother. Youngest kids often get stuck tagging along and doing everything last. An added bonus here is altering that pattern.

We made the above map in about an hour. We started in Google Spreadsheets, which he’d never used before (limited Internet), though he’d used OpenOffice Calc so understood how a spreadsheet works. He made the list of fifteen places he’d like to map. Then we used map search plus everything search to track down the street addresses and postal codes of all the places on the list. We got to talk about good web practices because the first few addresses we found were images of text instead of text — frustrating! He quickly learned we wanted addresses as selectable text so that there’d be no need to retype long strings of text.

Once all the addresses were found (we took turns after awhile because this was tedious) we added a data type for each: pool, library, school, restaurant, or coffeeshop and had a look at our choices for map icons. He decided which marker he wanted for each data type and we added that to the spreadsheet.

Next we imported the spreadsheet into Google Fusion Tables, set the map to grab location using the street address in the Address column and visualized as a map. Then we modified the map style to use the marker specified in the Icon column and cool! a map was born! He knows that he can go back to his map and add more data, re-purpose it, or use it as an example for a new one.

Once it was done, we shifted to a conversation about places he’d like to go. He navigated Google Street Maps to travel to Spain, Venice (to see canals), Paris (to see the Eiffel Tower), Iqaluit, Japan, Korea, and Rome. We walked down the streets in every place that had street view (we’re both bad at controlling the little person) and looked at the relationships between cities and large bodies of water.

I really do love these Friday night nerd sessions and I know that I’m making it normal to use computers for more than surfing. He’s learning that he can visualize his data, turn his stories into games, and make whatever he can imagine.